Fresh from the Oven - Updates in Forecast
A whole lot of great updates to Forecast.it has just been pushed live, so without further ado...
Images for multiple assignees on stories and tasks
Stories and tasks now have updated images so that it’s very easy to see if an item is assigned to multiple people. Simply all the assignees will have their image shown on each item so it’s highly visible and easy to work with.
Deadlines on tasks and updates to my activities
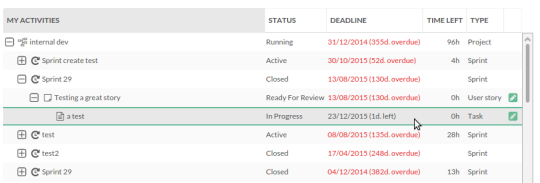
It’s now possible to set deadlines on tasks so you can have them be completed independent of sprint deadlines.
Also, my activities has been updated as a tree structure so it’s now very easy to see where all the individual work items a user is assigned goes in the hierarchy. You can still edit stories and tasks directly from the grid.
New hierarchy of projects, stories and tasks on home screen
Visual teams
Teams are now much more visual. This means that it’s now very easy to get an overview of which person is in which team. The same person can even be part of multiple teams and entire teams can be added to projects to make it super simple to populate projects with the right people, so they can get instant access to work.
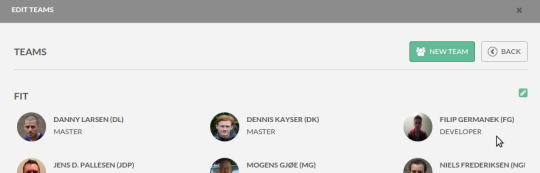
Easily see teams in a visual way
Budget now shown on project cards
We’ve updated the project cards to not only show progress but now also to show progress compared to the budget. This means that you easily can get an overview of how the actual progress of your project compares to the progress of spending money. This means that it’s very easy to keep your eye on the ball as the project is running. There's even a setting for turning if off for certain user roles.
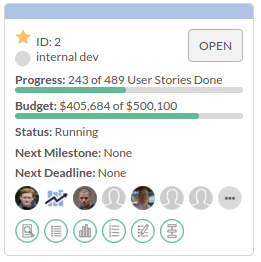
Budget on project cards
Updates to scheduling
To make scheduling even better to work with we have simplified it and added the option to filter the current project list. This again makes the whole scheduling part much easier and faster to work with. Also, if a project is now over-allocated with people the allocation meter will turn red to indicate that the project is over-staffed. Also, the allocation meter will show if the project is just in planning mode or if the project is actually running. This makes it possible to plan the exact right amount of people for each project. Additionally, it also shows the total project progress on each project card.
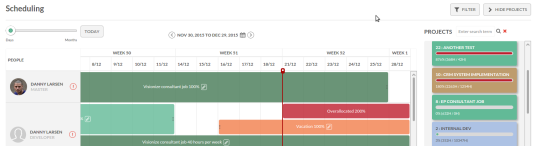
Updates to people scheduling
New users can be added from the global menu
A much requested feature is the ability to add new users directly from the global add menu. This is now possible and the the whole user section in the administration interface has also gotten a much needed overhaul.
An important change to this is that it’s now possible to add users that can not log into the system. This is very useful if you want to have users in the system that are only used for scheduling but should not have access to the system. When the time comes and they should be able to login, just change the setting and they’re good to go.
Assign person directly from quick task
When creating a quick task it’s now possible to assign the task to someone else than yourself while creating the task. This is great if you create tasks for other team members to complete as it speeds up the whole process.
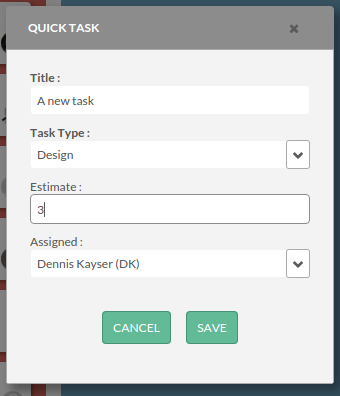
Assign person when creating a task
Billable hours and updates to the utilization report
It’s now much easier to set billable hours on both projects and individual tasks. If you set either billable or non-billable as default on a project, all tasks will inherit the setting, but can be overwritten individually. Also we’ve updated the utilization report to be much more visual.
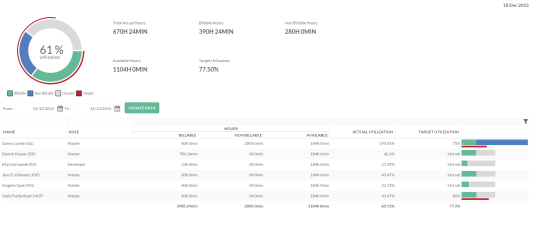
Utilization report
Comments on stories and tasks
Users can now post comments on stories and tasks. This makes it easy to have better team collaboration as you can see who is asking what questions and easily answer them directly on the relevant item. Also, it adds traceability as it's now possible to track what decisions were made on individual items.
Updates to initial planning - Work Breakdown (SoW) and Other Costs
We have also cleaned up the Work Breakdown (SoW) and Other Costs (OC) modules so they are much easier to work with, without horizontal scrolling. You can now get the full overview on one screen and if you want to see more details you can edit each line to see the full set of information.
It’s now also possible to see which stories/tasks are linked to each line in the SoW and OC. When deleting a line in either of these you’ll be asked if you want to delete the associated stories/tasks as well. This makes it very easy to have full traceability from end-2-end.
Point scales in agile
As a much requested feature it's now possible to use points instead of hours when doing agile projects. This means that if you don't want to use hours for your stories, you can use more abstract points instead. It's very easy to set up in the project templates and multiple methods can be used.
The following options are now available:
- Hours (default)
- Linear (0, 1, 2, 3)
- Powers of 2 (0, 1, 2, 4, 8, 16, 32, 64, 128)
- Fibonacci (0, ½, 1, 2, 3, 5, 8, 13, 20, 40, 100)
- T-shirt (XS, S, M, L, XL, XXL)
As always we hope you enjoy the new features and by all means let us know if you have any requests.
The oven is still cooking... If you want to see a demo of what Forecast has to offer; then book a personal 30 min. slot with our success team.