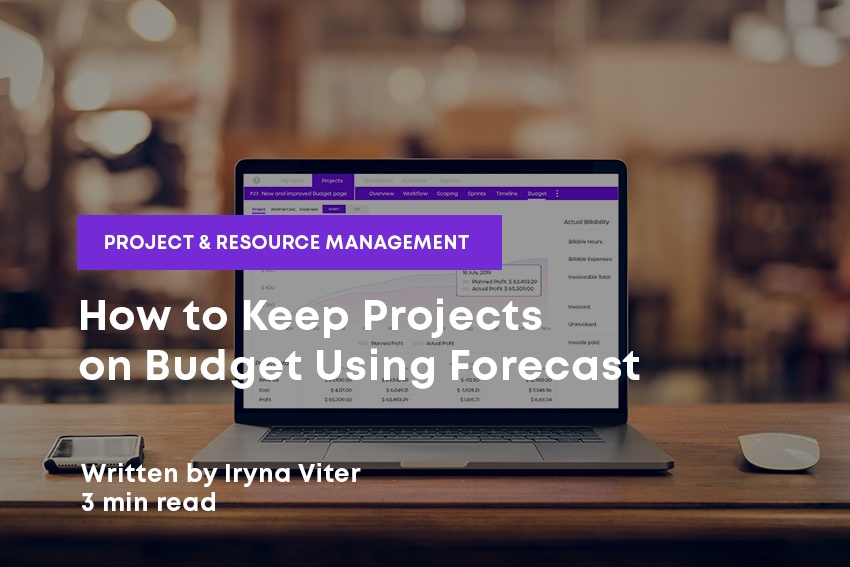
New Superior Budget Solution for Your Project Management

Project budgeting has just become a lot easier. Forecast is introducing a new visual and intuitive way of planning and monitoring project financials. The feature, available as part of our premium plan, is designed to provide executives with a holistic real-time overview of financial data, allowing you to see if projects are earning money or simply eating them up. The new improved budget ties into the vision of Forecast to show the information on a higher level and gives users the ability to drill down and get an understanding of each element when they want it. Here’s a short summary of what you can do:
- Quickly measure the health of the project based on revenue, cost, and profit.
- Get a smooth and swift overview of the project financials that allows you to follow the progression and act on real-time insights rather than spend time collecting data that's already outdated.
- See the billability and what is invoiced to make sure the plan is on track and avoid a change of request.
In essence, what you get is an extremely flexible budget that always makes you one step ahead of project financials.
Track actuals vs. planned in a single view
First off, you can see how the project is progressing when time and money come to play, project-wise. The visual graph illustrates how the running project financials will look like and what the actuals are. Based on the time entries and status of the tasks, you follow the progression and see how the planned revenue differs from the actual revenue, in a single graph view.
Access every number
When you've had enough of a high-level picture, you can easily adjust the view and filter the numbers. Every number can be accessed and zoomed in depending on what you want to see. For your convenience, there is a day, week, and month view.
Tailor the view of the project budget
The flexibility of the budget allows you to tailor your view. Tick what you want to see or remove unnecessary details from the show. You’re in control of how you prefer to work. The system allows you to follow the project accounting both with a broader stroke and the smallest details in sight.
How? The filters under the eye icon enable you to change the view of the budget that suits your needs. Scroll down and tap into specific data:
- Follow the total price of work and expenses.
- Drill down to Work details tap to see the revenue, cost, and profit each milestone and role has generated.
- Expense details enable you with a view of the cost, profit, and how much the project will cost to the client.
- The Invoice plan lets you know how much has been invoiced and what has been paid.
- Assess the billability by following the time entries, expenses, and what have been invoiced and paid.
Add extra expenses
Tiering your project with different expenses, you can add them directly in the budget tab and monitor if they are billable or non-billable. The system sums them up and calculates them together with the revenue. Anyone has permission roles to add the expenses, but only controllers or admins can approve them.
In Forecast, we connect every part of your project in a view that allows you to monitor the progression and get the insights when and where you want them. When you add, change, or create new tasks, assign team members, and set up new projects, you can see it reflected all over.
Want to get started right away? Login to Forecast or read the Help Center Article for more detailed descriptions.