Keep Productivity High With the Newest Release to Forecast
With the brand-new update to Forecast’s Schedule, we are introducing a more efficient and user-friendly way of managing your resources. Among other benefits, you’ll experience a cleaner design, show and hide functions, flexible allocations, and a more comprehensive way of allocating resources, which will make you the fastest resource manager ever seen.
Forecast's intuitive resource management solution provides you with an overview of everyone’s workload and capacity to optimize resource utilization and solve resource bottlenecks, giving you proper control from start to finish. Closely connected with projects and tasks, allocations in Forecast are automatically generated to help you manage resources better and make wiser future decisions.
Project & task allocations
Minimize errors and clear the path for efficient operations with a streamlined way of allocating team members. Choosing project or task allocation on a company-wide level, you decide how you want team members to be allocated, ensuring allocations are handled optimally across the entire resource pool.
Whether you work with loosely defined scopes with room for many iterations or sharply defined projects, the allocation supports your preferred methodology. Allocating your team members to projects provides a clear understanding of when your team is available to work on the project. Allocate them to the hours you need and even have them assigned to several projects if needed.
If you are more into having an overview of what tasks each team member is working on right now, you’d benefit from using task allocations. Likely, you’ll be working with more clearly defined scopes and know when you need each team member to work on each task to reach the deadline.
Planned, actual & remaining allocations
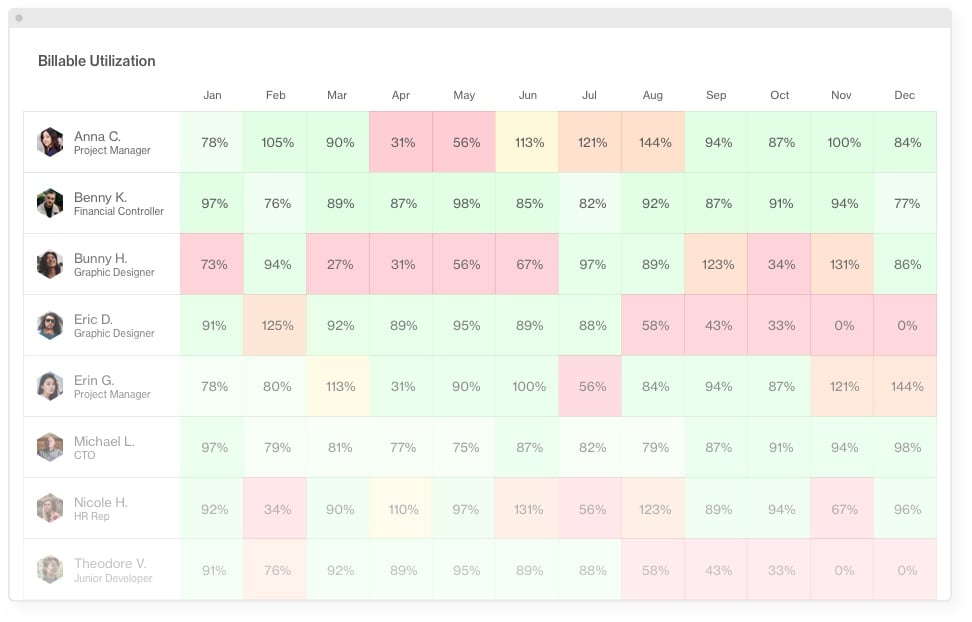
Depending on which allocation type you’ve chosen, you’ll have different options to monitor the heatmap. Both types allow you to view it from a planned perspective, but with task allocation, you’ll have another option to see it from an actual perspective too. Choosing to see the heatmap in actuals will give you an understanding where time registrations are represented (in blue) in the past, and the remaining time on a task is visualized in green in the future. This enables you to easily spot if you are faster or slower on a specific task and how that affects the billability. Whether you choose planned or actual calculation, the actual and predicted billability can always be monitored in the utilization report.
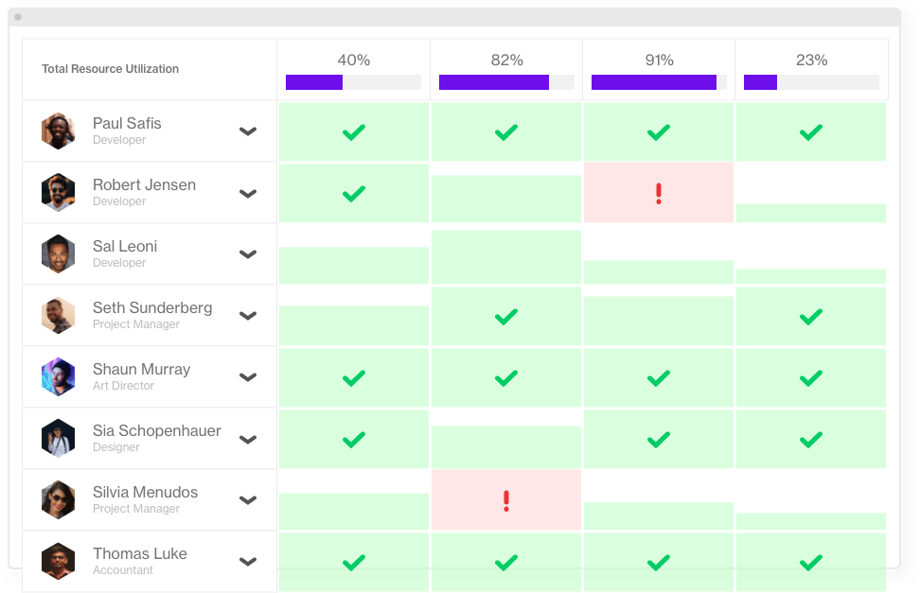
Managers can have a quick breakdown of people’s Resource Utilization and the Resource Utilization Graph shows you how much each person is utilized so your company can remain at their fullest capacity.
Time off or availability
What is resource management without the ability to see when people are off? No matter what type of allocation you choose, the heatmap clearly distinguishes between allocations and time off to give you a better overview of who is available and not. Start the balancing game and ensure a consistent stream of vacation to keep the team happy and your company sustainable.
A flexible view tailored for every day
An easy and intuitive interface with more relaxed colors assures a better overview and ability to decode the information faster. With a few clicks, you can completely change the view and choose to look at the entire heatmap or at what projects are coming up.
Split, edit, duplicate, and adjust accordingly to save time when making changes directly in the heatmap. Allocate and assign multiple or single team members intuitively by dragging and dropping or by using the new updated modal. The modal is a unique card for each team member with allocated hours and utilization rate, so you can spot where time is spent and optimize it.