Forecast: 2018 in Review

What a year 2018 has been! Here, at Forecast, we started the year as a team of 14. Now, as of December, 12 months later, the Forecast team does now consist of 36 inspired young (wo)men. Naturally, to house 22 more people, we had to move. Thus, 2018 also involved a move from our, historically, second office into a brand new office, freshly furnished, painted and styled to match the Forecast brand. All, right in the heart of Copenhagen city.
Thanks to more hands being involved, we’ve also been able to move faster than ever before in terms of the product itself. The product that all of you are using on a daily basis to organize, structure, and collaborate on tasks across your projects and teams.
This, *cough cough* brag, post will highlight some of all of the things that happened over the past 12 months on the Forecast platform.
Connected Projects
Connecting projects, as the words imply, is a new way to align projects that are related in one way or another. Ensuring that teams have a shared place to stay in the loop, tasks can move along in connection with others, and time and dependencies can be tracked.
Dependencies
Yes, dependencies, as mentioned above, is likewise an addition of 2018. A very frequently requested addition to the tool is now available. Letting you set up dependencies and prerequisites between tasks in your projects.
New Insights
Utilization Graph, Portfolio, Sprint Burndown Chart, etc. Insights into your business is important. That’s why we’ve also prioritized to expand the number of components available to build your reports. New ones are coming gradually, but 2018 was also the year that we saw the first AI-powered insights arriving.
.png?width=1200&name=Insights%20and%20reporting%20(1).png)
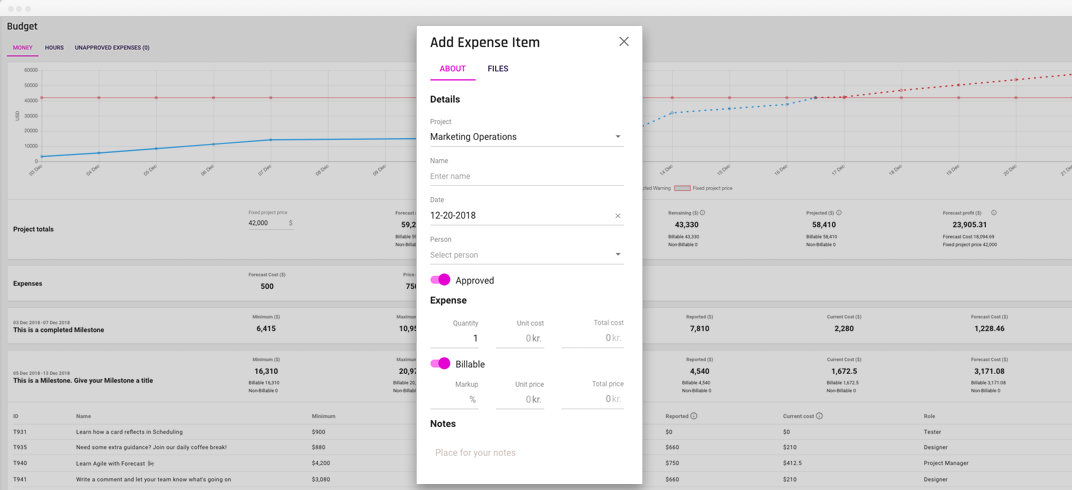
Expense Reporting
Keeping track of expenses used by your team for various projects can be a tough job. That’s why we made it possible for team members to report their own expenses directly in Forecast. All the Financial Controller needs to do now is just to look that everything is correct and accept the receipt.
New Integrations
Xero, Visual Studio, JIRA, GitLab, Zapier. What is a project management tool if you can’t connect it with all the other tools that you use throughout your week? Not much, right? So, as we’ve seen a demand from you, our users, we’ve gradually started developing and updating integrations to allow for more seamless and smarter workflows to flourish.
Update of the Time Page
Now, the ability to report time has always been available in Forecast. In fact, it has always been one of the key features of our software. So, in 2018, our developers and product teams, worked hard on updating the Time page with new Day, Week, and Month views, as you know it from, e.g., Google Calendar or Outlook, and implemented a new ability to add a note to your time entries. This allows both team members, and managers, to communicate any information that may be important for a certain registration.
![]()
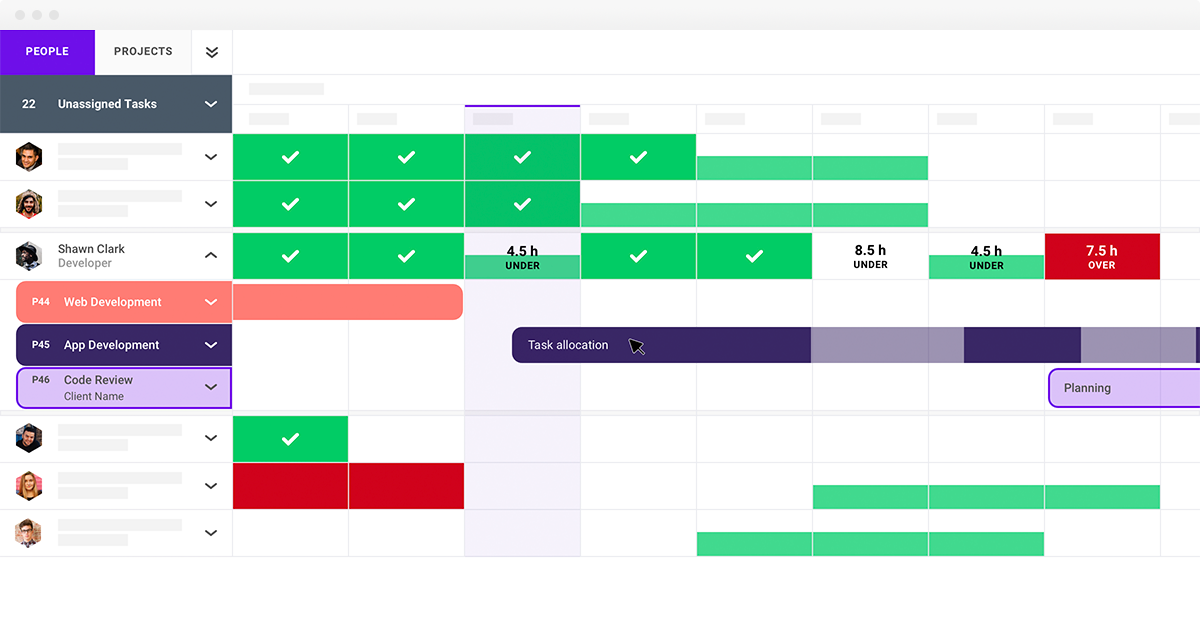
New Scheduling with Task Allocations
This is a big one! Scheduling was updated. Not “just” the completely new design, but we also introduced Task Allocations. Now, it’s possible to allocate team members to tasks, where needed, directly from Scheduling. Now, having the convenience of seeing everybody who's available, with the right role, and allocate to the tasks that could use a lil’ help.
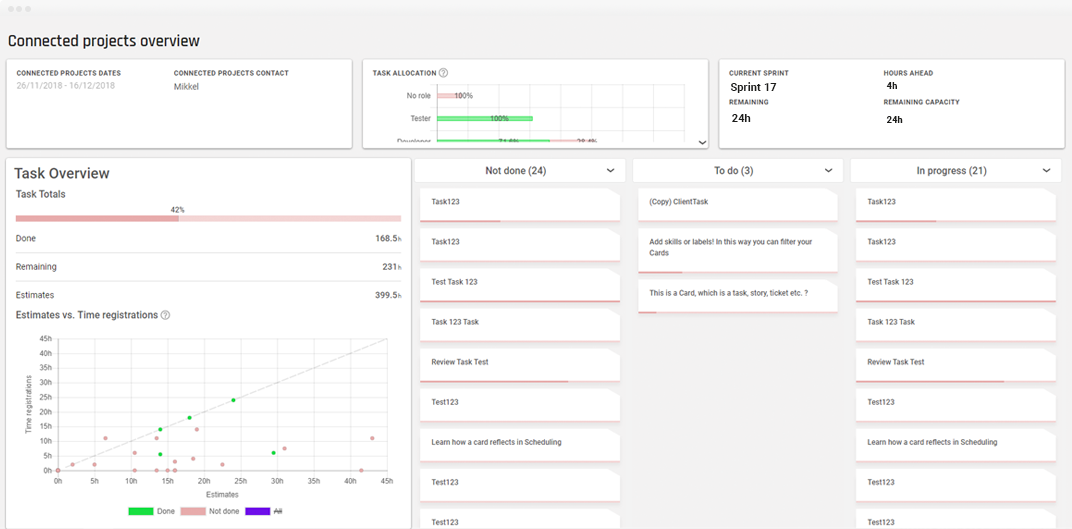
Project Overview for Projects with Task Allocations
In connection with the launch of Task Allocations; we thought it would be nice with a Project Overview tailored specifically for projects using task allocations. So, we expanded our original Project Overview with a new version that automatically shows you the best view of your project whether you’re using Project Allocations or Task Allocations.
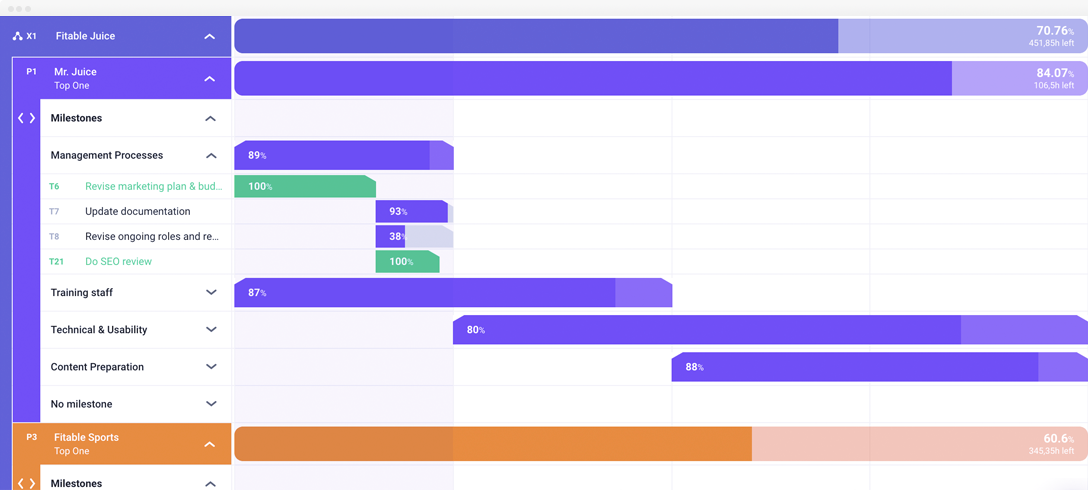
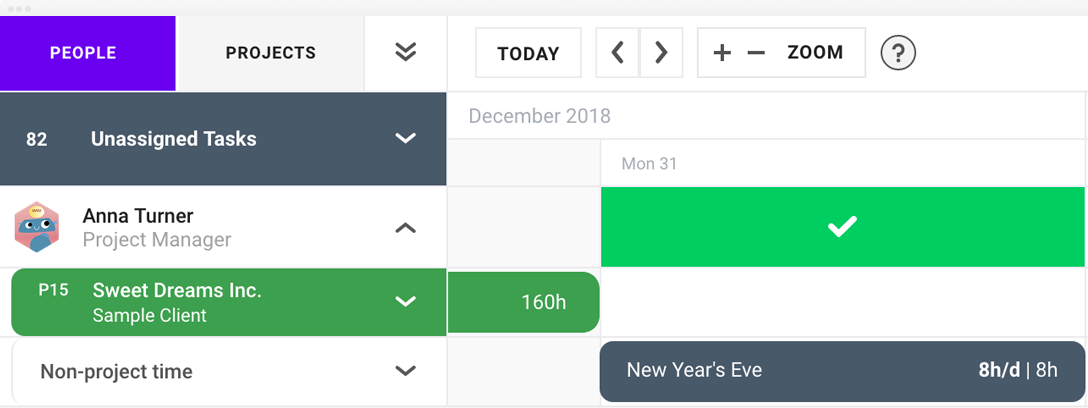
Updated Timeline, Connected Projects Timeline, & Holidays Calendar
Inspired by Scheduling, the new design followed-through to the Project Timeline as well. But besides that, we also introduced a Timeline for Connected Projects. Here, think Gantt chart for a selection of projects. That’s exactly what it is. Allowing you to view and manage the timeline across connected projects in your portfolio.
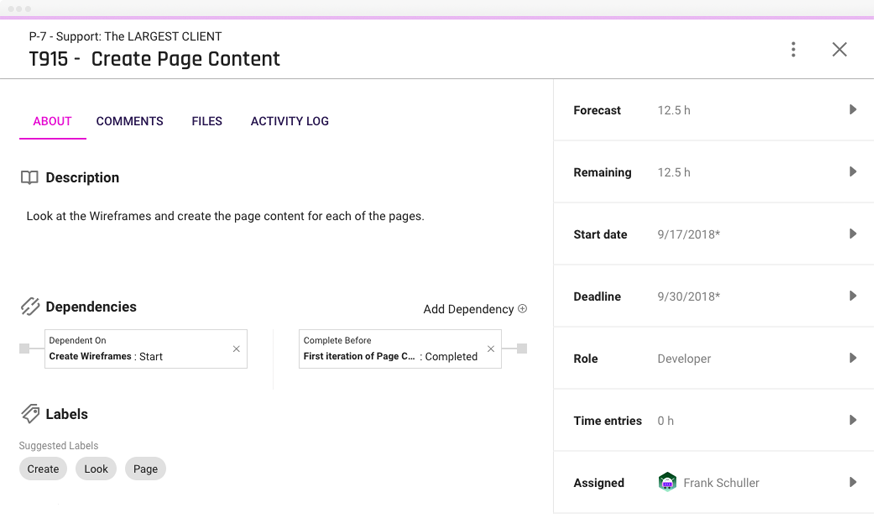
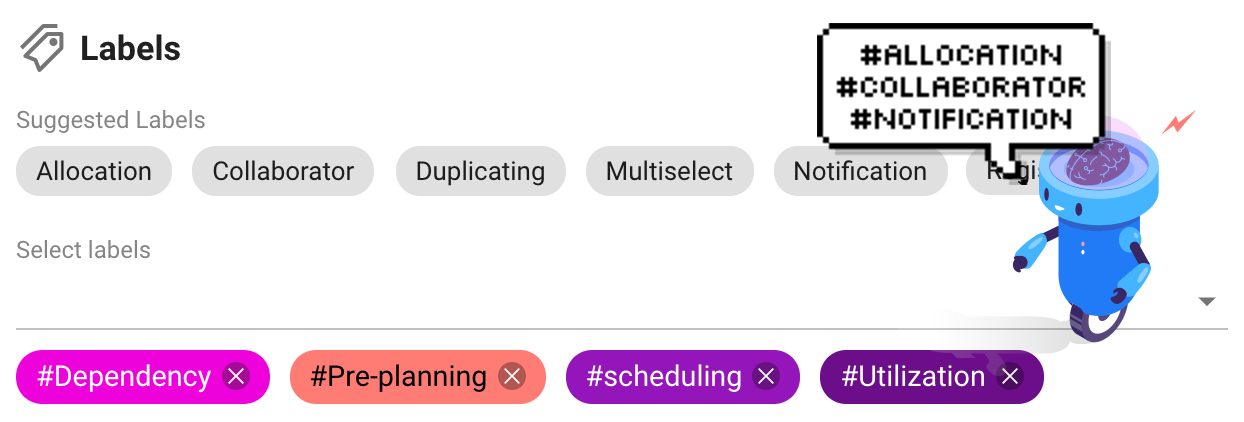
More AI to Assist Your Work
As one of our key features is Artificial Intelligence; this was of course also on our roadmap this year. In 2018, we added smart labeling through the help of Natural Language Processing (NLP) that assists our backbone in understanding what your specific task implies and suggesting just the right labels for you.
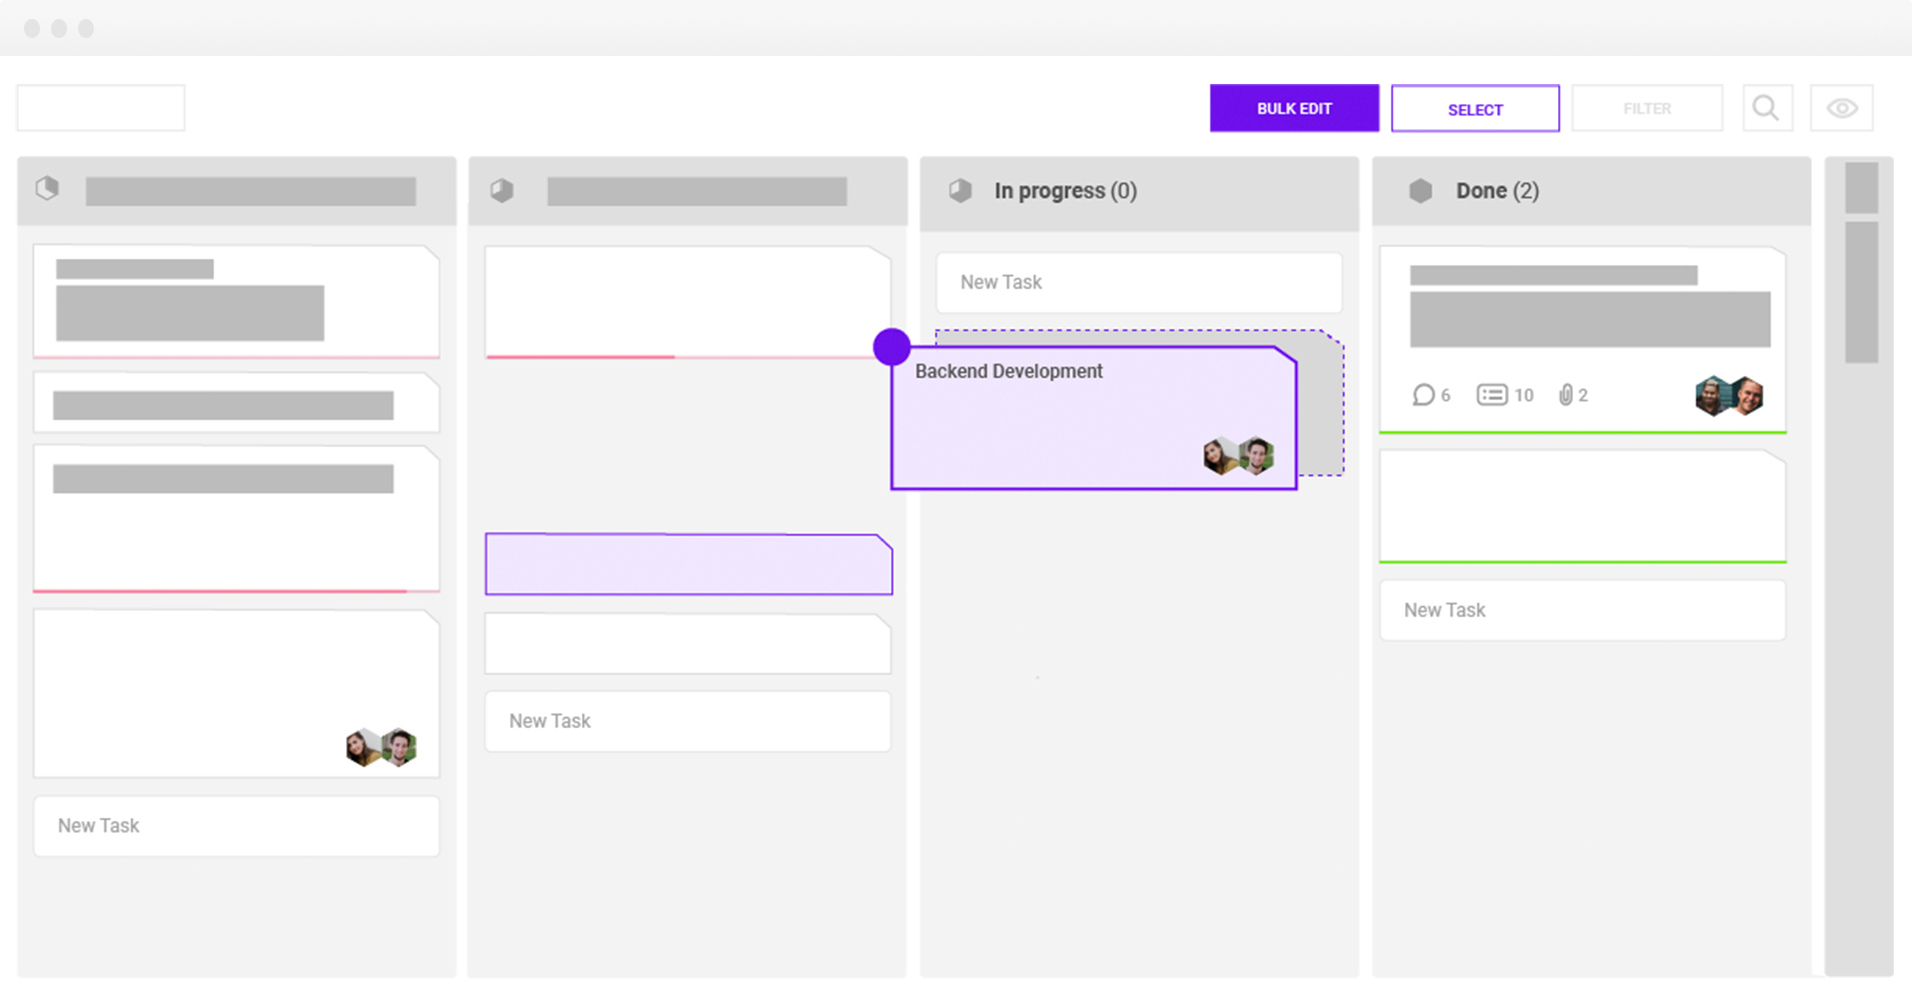
Bulk Updating
Don’t you absolutely hate repetitive work? Thought so. We do too. That’s why we added the ability to bulk update tasks in your Workflow and across other parts of Forecast. Now, you just select multiple items through the commonly known checkbox and choose the action you want to take through the menu. Easy as that.
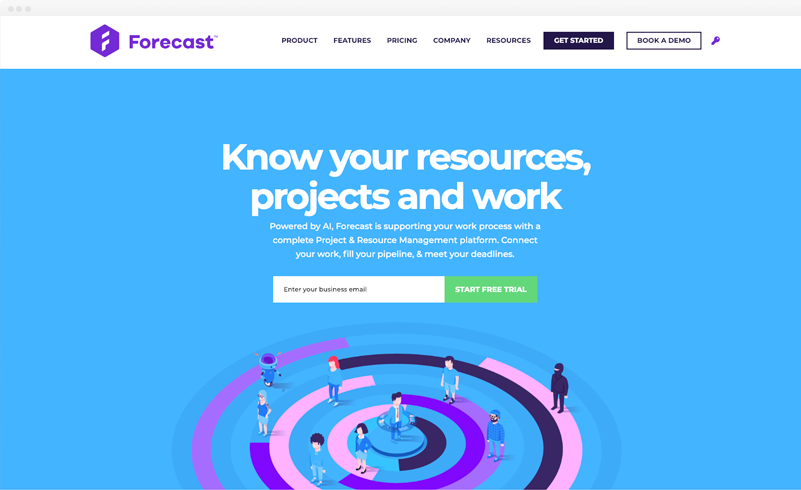
New Website & Design
Finally, we ended the year with a successful launch of the all-new Forecast website. A website that fits with the revised Forecast brand and matches with the changes happening to the Forecast platform right now. The new design is gradually rolling out and soon you’ll experience a completely revised Forecast platform, better, more intuitive, and vibrant than ever before.
Here’s to an even better 2019! We wish you all Happy Holidays, whatever you’re celebrating, and a very Happy New Year! 🎉